Premier Home Page

Home | Training | Solutions |Contact Us

t: +44(0)20 7729 1811
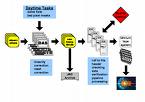
 
About Us | IT Training | Financial Training | Management Training |Delegate Information


Visio 2013 for Flowcharting

This course will focus on the practical application of Business Process Mapping with Microsoft Visio. Microsoft Visio is a powerful tool with extremely powerful functionality that enables a vast range of diagrams to be produced with minimal effort. Across the world Visio is used to produce process maps and flowchart diagrams. This insightful course will enable you to document, understand and improve your organisation’s business processes in a diagramatic format.
Visio training courses in Londonvisio training courses in London

Module 1 – Overview of Visio
Definitions
The screen layout
Stencils and drawings
Using stencils to create drawing
Working with multiple stencils
Saving, closing and opening files

Module 2 – Working with Shapes
Working with handles
Selecting objects, working with objects
Attributes, aligning, distributing, rotating, Flipping, Grouping, Shape order

Module 3 – Working with Text
Text in shapes, Creating Free standing text
Text enhancements (Alignment, point size, colour)
Working with text independently from objects

Module4 – Connecting Shapes
The Different Connectors available
Drawing connectors
Using dynamic glue
Working with connector points

Module 5 – Visio Pages
The page views
Adding, Deleting, Renaming pages
Background pages
Page Orientation (portrait, landscape)
Printing drawings

Module 6 – Creating Flow Charts with Visio
Basic principles of Flow charting
Why draw a Flow chart?
Use of Flowcharts
Process Mapping Symbols – an overview
A Flowcharting example

Module 7 – Different Styles of Flow Charts
Different type of Flowcharts
Drawing a basic process map diagram
Drawing a Functional Flowchart
Cause and Effect diagrams
Data Flow diagrams
Tips for Creating Flow Charts
An overview of Process Mapping

Module 8 – Using Drill Downs for Process Mapping

Module 9 – Shape Data with Visio
What is Shape Data
How do they help with Process Mapping?
Creating and editing Shape Data
Building Reports from Shape Data
Showing Shape Data on an Internet/Intranet site

Module 10 – Integrating Visio
Taking Flow Charts into Word to integrate within other applications
Using Hyperlinks to link process diagrams to other documents / websites
Using Visio Diagrams in SharePoint

4 Ravey Street
London EC2A 4QP
t: +44(0)20 7729 1811
f:+44(0)20 7729 9412
information@premiercs.co.uk